
")


Markets head into the week with renewed momentum following Fed Chair Jerome Powell's Jackson Hole remarks, which fueled expectations of a September rate cut and drove the Dow to a record close. Attention now turns to a series of key economic releases — from Australia's inflation data and US GDP to Canada's growth figures and China's manufacturing PMI — that could influence global sentiment. At the same time, technical signals on the Dow remain broadly constructive, though emerging divergences suggest caution. Nvidia's upcoming earnings will serve as a critical test for the durability of the rally and investor conviction in AI-driven growth.

Overview
Markets head into the week with renewed momentum following Fed Chair Jerome Powell's Jackson Hole remarks, which fueled expectations of a September rate cut and drove the Dow to a record close. Attention now turns to a series of key economic releases — from Australia's inflation data and US GDP to Canada's growth figures and China's manufacturing PMI — that could influence global sentiment. At the same time, technical signals on the Dow remain broadly constructive, though emerging divergences suggest caution. Nvidia's upcoming earnings will serve as a critical test for the durability of the rally and investor conviction in AI-driven growth.
Key Economic Events
Wednesday 04:30 am (GMT+3) - Australia: CPI y/y (AUD)
Thursday 15:30 (GMT+3) - USA: Prelim GDP q/q (USD)
Friday 15:30 (GMT+3) - Canada: GDP m/m (CAD)
Friday 15:30 (GMT+3) - USA: Core PCE Price Index m/m (USD)
Sunday 04:30 am (GMT+3) - China: Manufacturing PMI (CNY)
Chart Analysis
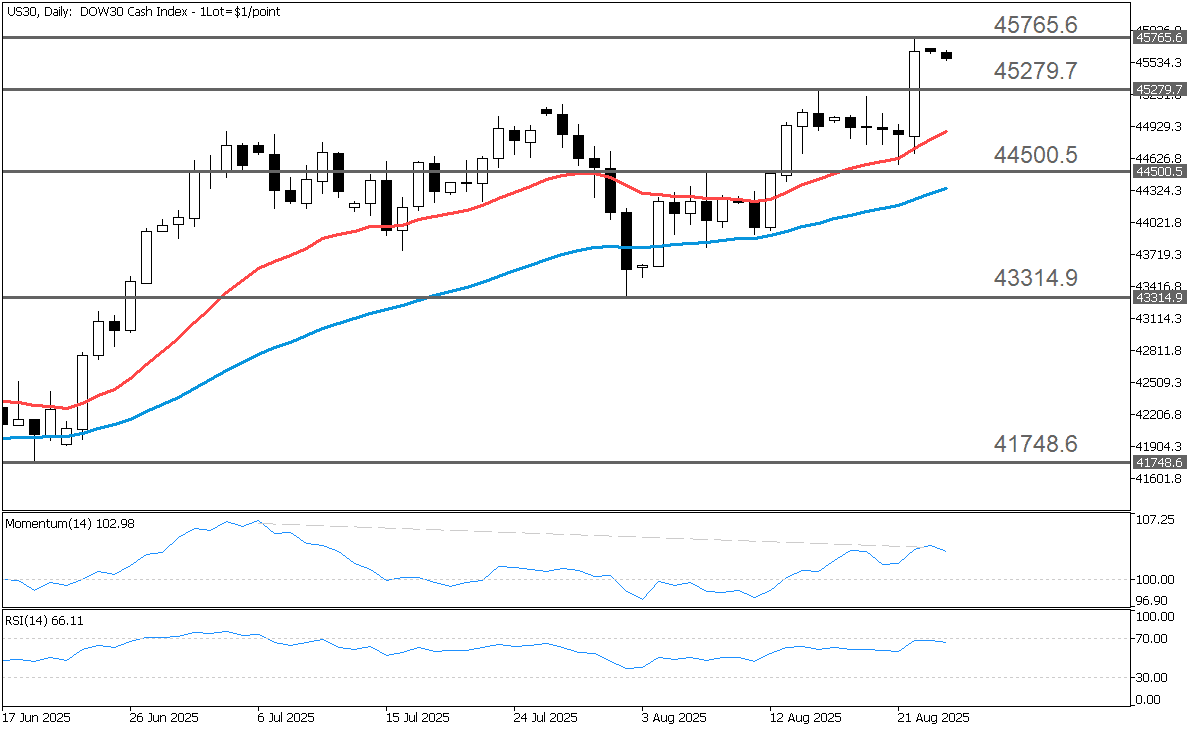
Since bottoming at 36,494.8 on April 6, the Dow Jones Industrial Average has entered a constructive phase, defined by a steady sequence of higher highs and higher lows — a classic signal of an emerging uptrend. The initial reversal was marked by a bullish Abandoned Baby candlestick formation, reinforced by a failure swing in which the trough at 37,820.6 held above the prior low. A subsequent breakout through resistance at 40,911.8 confirmed the bullish shift and cleared the way for further upside potential.
Technical confirmation has also come from a Golden Cross double crossover, with the 20-period EMA moving above the 50-period EMA, validating the rally and supporting additional gains. Momentum indicators remain aligned with this outlook: the Momentum Oscillator is holding above the 100 baseline, reflecting persistent upward pressure, while the Relative Strength Index (RSI) continues to trend above the 50 level, signaling firm buying conviction. However, the development of a negative divergence between price action and the Momentum Oscillator warrants caution, signaling a potential pause in the rally.
Key Resistance Levels
Should the buyers maintain market control, traders may direct their attention toward the four potential resistance levels below:
45,765.6: The initial resistance level is established at 45,765.6, which mirrors the all-time high reached on August 22.
46,079.9: The second price target is set at 46,079.9, representing the weekly resistance, R1, calculated using the standard Pivot Points methodology.
46,434.1: The third price objective is observed at 46,434.1, corresponding to the 261.8% Fibonacci Extension drawn from 45,279.7 to 44,566.2
47,588.6: An additional upside target is projected at 47,588.6, reflecting the 423.6% Fibonacci Extension drawn from 45,279.7 to 44,566.2
Key Support Levels
Should the sellers take market control, traders may consider the four potential support levels listed below:
45,279.7: The initial support level is seen at 45,279.7, corresponding to the peak from August 15.
44,500.5: The second support level is estimated at 44,500.5, representing the trough marked on August 21.
43,314.9: The third support level is identified at 43,314.9, reflecting the low point marked on August 1.
41,748.6: An additional downside target is 41,748.6, mirroring the swig low from June 19.
Fundamentals
US stocks surged on Friday after Fed Chair Jerome Powell signaled the possibility of a September rate cut in his Jackson Hole speech. The Dow Jones jumped 800 points to a record close, while the S&P 500 and Nasdaq each gained around 1.5%–1.9%. Powell acknowledged upside inflation risks tied to tariffs but said shifting conditions may warrant adjusting policy. Traders quickly raised the odds of a September cut to over 90%. Treasury yields dropped, while Bitcoin and Ethereum also rallied.
Dow Jones futures edged lower Sunday night after a strong Powell-led rally pushed the Dow and S&P 500 to record highs last week. Small caps surged to 2025 highs, while the Nasdaq trimmed midweek losses. Growth stocks also rebounded, with several flashing buy signals. The spotlight now shifts to Nvidia, whose earnings and guidance on Wednesday are expected to be a major test of market momentum and AI-driven optimism. Analysts say results could determine whether Friday's rebound extends across sectors or proves short-lived.
Conclusion
Markets enter the week with bullish momentum but remain sensitive to upcoming economic data and corporate earnings. While technical signals on the Dow continue to favor the upside, negative divergences suggest the possibility of near-term consolidation. Key releases, including US GDP and Core PCE, along with Nvidia's earnings, will likely set the tone for risk appetite and determine whether last week's rally extends or stalls. Investors should remain alert to both opportunities and risks as macro fundamentals and technical signals converge at a critical juncture.