
")


With the week already underway, attention now turns to a series of high-impact releases, beginning with UK inflation data today, followed by PMI figures from Germany, the UK, and the US on Thursday. These reports will provide fresh insight into how major economies are navigating the trade-off between slowing growth and persistent price pressures. Meanwhile, monetary easing in New Zealand and growing speculation about potential Federal Reserve rate cuts continue to shape market sentiment, keeping volatility elevated.

Overview
With the week already underway, attention now turns to a series of high-impact releases, beginning with UK inflation data today, followed by PMI figures from Germany, the UK, and the US on Thursday. These reports will provide fresh insight into how major economies are navigating the trade-off between slowing growth and persistent price pressures. Meanwhile, monetary easing in New Zealand and growing speculation about potential Federal Reserve rate cuts continue to shape market sentiment, keeping volatility elevated.
Key Economic Events
Wednesday 09:00 am (GMT+3) – UK: CPI y/y (GBP)
Thursday 10:30 am (GMT+3) – Germany: Manufacturing PMI (EUR)
Thursday 10:30 am (GMT+3) – Germany: Services PMI (EUR)
Thursday 11:30 am (GMT+3) – UK: Manufacturing PMI (GBP)
Thursday 11:30 am (GMT+3) – UK: Services PMI (GBP)
Thursday 16:45 (GMT+3) – USA: Manufacturing PMI (USD)
Thursday 16:45 (GMT+3) – USA: Services PMI (USD)
Chart Analysis
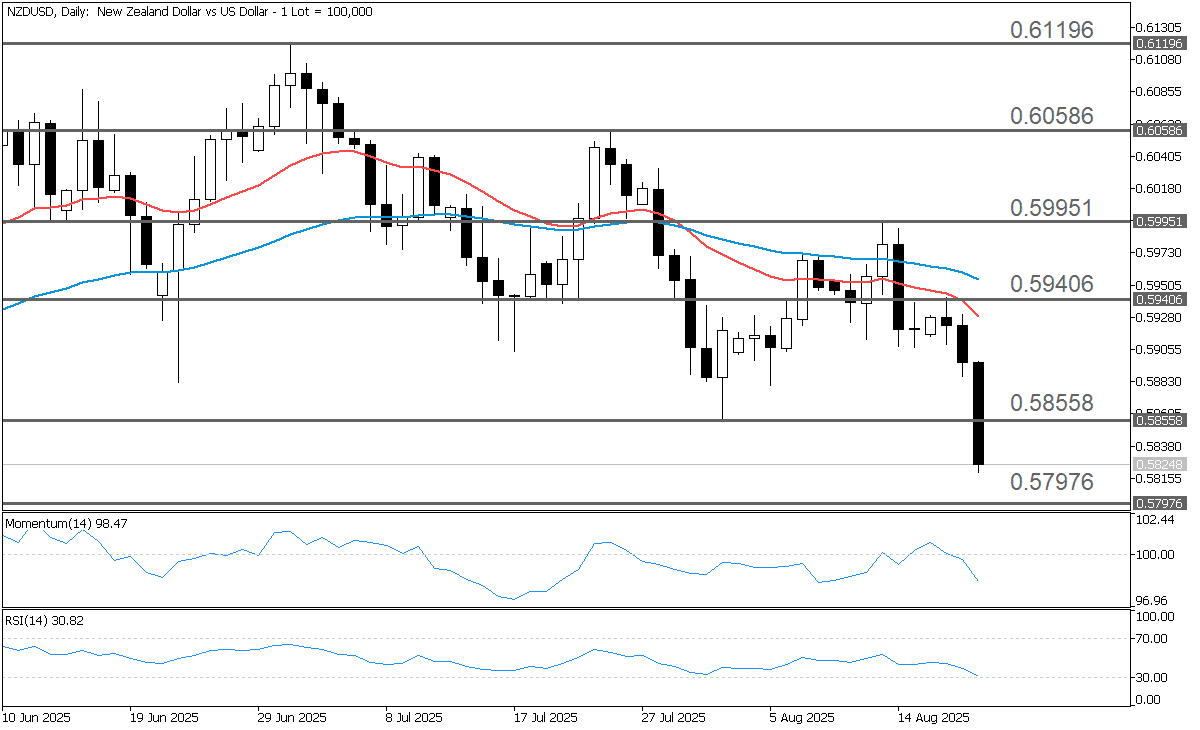
Since establishing a low at 0.61196 on July 1, NZDUSD has extended its decline, tracing a clear sequence of lower highs and lower lows. The initial reversal was signaled by a failure swing, with the rally stalling at 0.60427—below the prior peak—before the pair broke support at 0.59751, opening the way for further downside. The bearish momentum was reinforced by a “Death Cross,” as the 20-period EMA crossed beneath the 50-period EMA, amplifying negative sentiment.
At present, price action remains below both the 20- and 50-period EMAs, with both averages sloping downward, consistent with continuation of the prevailing downtrend. Technical indicators corroborate this view: the Momentum Oscillator is lodged below the 100 baseline, pointing to persistent selling pressure, while the RSI holds comfortably beneath the 50 level, highlighting a sustained lack of buying interest.
Key Resistance Levels
Should the buyers take market control, traders may direct their attention toward the four potential resistance levels below:
0.58558: The initial resistance level is established at 0.58558, which mirrors the swing low from August 1.
0.59406: The second price target is set at 0.59406, representing the weekly Pivot Point, PP, calculated using the standard methodology.
0.59951: The third price objective is observed at 0.59951, corresponding to the high point marked on August 13.
0.60586: An additional upside target is projected at 0.60586, reflecting the swing high recorded on July 24.
Key Support Levels
Should the sellers maintain market control, traders may consider the four potential support levels listed below:
0.57976: The initial support level is seen at 0.57976, corresponding to the weekly support, S3, estimated using the standard Pivot Points methodology.
0.57697: The second support level is estimated at 0.57697, representing the 161.8% Fibonacci Extension drawn from the swing low, 0.58558, to the swing high, 0.59951.
0.56304: The third support level is identified at 0.56304, reflecting the 261.8% Fibonacci Extension drawn from the swing low, 0.58558, to the swing high, 0.59951.
0.54050: An additional downside target is 0.54050, mirroring the 423.6% Fibonacci Extension drawn from the swing low, 0.58558, to the swing high, 0.59951.
Fundamentals
On 20 August 2025, the Reserve Bank of New Zealand cut the Official Cash Rate (OCR) by 0.25% to 3%. The decision came as the economy slowed in the second quarter, with weaker household spending, falling employment, and declining house prices. Inflation is currently near the top of the Bank's 1–3% target range and is expected to rise to 3% later this year due to higher food and energy costs, before easing back toward 2% by mid-2026.
The Bank noted that there are both upside and downside risks: growth could stay weak if households and businesses remain cautious, but the recovery may pick up as interest rate cuts filter through. If inflation pressures continue to ease, the Bank signaled there is room to lower rates further.
On the other hand, US stocks hit record highs last week as investors grew hopeful the Federal Reserve could start cutting interest rates as soon as September. The optimism was fueled by July inflation data showing slower growth in consumer prices, thanks to cheaper food and energy. However, core inflation — which excludes food and energy — ticked higher, keeping some concerns alive.
Later in the week, producer price data came in much hotter than expected, sparking worries about persistent cost pressures. Retail sales showed solid gains, but consumer confidence slipped as households remained uneasy about inflation. Bond markets reflected the mixed signals, with long-term Treasury yields rising while short-term rates dipped.
Conclusion
In conclusion, markets remain caught between signs of slowing growth and persistent inflationary pressures. With UK CPI and global PMI data in focus, alongside policy moves from the RBNZ and speculation around potential Fed rate cuts, traders should expect heightened volatility. Clearer direction will likely emerge as this week's data confirms whether central banks can sustain a path of easing without reigniting inflation concerns.